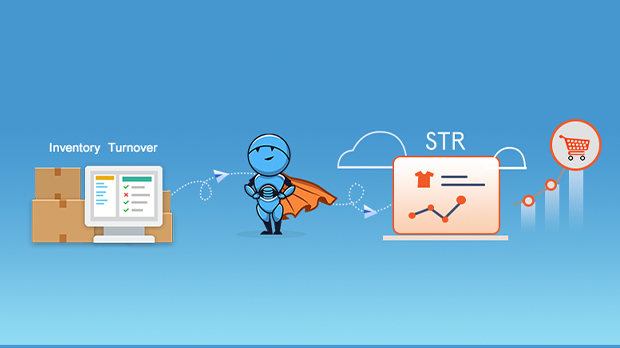
Inventory management has always been difficult with omnichannel presence for businesses, especially in an eCommerce environment. But a company has to maintain the correct balance between its inventory and market trends to meet the demand of its customers. In the Inventory Management System, Sell through rate is a vital index for determining the performance of products. It is a useful metric that indicates how fast a company turns over its inventory within a specific period. Moreover, it will guide the business to perform the necessary alterations in its inventory strategy. This will minimize the inventory and storage costs of the company. Therefore, Sell Through Rate is considered an essential retail sales metric that will allow you to monitor the overall efficiency of your supply chain. Let us see how to calculate sell-through rates accurately using inventory data.
Why is the Calculation of Sell-Through Rate Necessary
Sell Through Rate can be calculated as:
STR = (actual units sold* / initial stock on hand) x 100
Actual units sold can be defined as the total sales across all channels, which must be equal to the inventory and unsold stock in store. Inventory Snapshot will update you on the regular stock of products and their costs for a company. Obtaining only the inventory snapshot will not help you calculate the Sell Through Rate accurately.
A Sell Through Rate of 40% is considered common and average, while STR of 70% is a superb number to be achieved. A good Sell-through rate will be more beneficial to monitor the inventory for a short duration of time than an inventory turnover. The following can be listed as the most important Use-cases of Sell-through rates:
- Analysis of STRs can be done to study the selling trends for the present and on historic periods. Seasonality trends can factor in making pricing decisions
- STRs will indicate whether the inventory is moving fast or slow. Hence will prevent a slow-moving inventory to turn into a dead inventory.
- STRs also help businesses to identify and manage unexpected sales increases through the comprehensive study of past trends in sales. So, it will help in devising a strong inventory strategy.
Challenges Faced By Businesses To Calculate Sell Through Rates
Calculation of Sell Through Rates requires the collection of Overall Sales data and inventory data. The problem arises when companies sell their products on multiple sales platforms like their website, mobile app, Amazon, Flipkart, eBay. In addition, they might make use of eCommerce platforms like WooCommerce, Shopify, Magento etc. The sales data is also required from online and offline channels, and store stock must also be factored in a while, arriving at the actual sales figures. It can be more comfortable for businesses to get real sales data if they have data from Inventory, Online Sales, and Offline Sales at a centralized data warehouse. So essentially, they need to manually collect the sales reports from various channels and platforms used and then consolidate that data and compare it with the inventory data to calculate the Sell Through Rate. This compiling of reports is a difficult task in itself, and it takes much time to prepare reports which are then analyzed, based on which steps for improvement are taken. This time lag is one of the biggest challenges that companies face, as effectively they are losing money until necessary changes are identified and executed. Further, the time lag involved makes the real-time calculation of Sell Through Rates impossible leading to slower analysis of business and even slower decision making.
Moreover, to make a complete analysis, companies need to make a perfect sense of the supply and demand. Thus needs to analyze data coming from customer service platforms, marketing platforms, logistics platforms, and sales and inventory data, making the process even more complicated. In addition to this, several platforms do not provide historical data.
How To Calculate Sell Through Rate With Accuracy
Formula for Sell Through Rate = (the number of units sold ÷ the number of units received) x 100.
Ideally, sales and inventory data need to be compared along with marketing and customer feedback data. This ensures that the demand and supply are optimal, budget allocation is done correctly, redundant listings are removed, and customers get a unified and satisfactory experience across various sales channels. This enables businesses to increase their revenue as many of the budgets are allocated in different verticals, and slow-moving products are used in the best possible manner. For this process to be effective, this data analysis is to be done regularly, and all of the data is to be synced in real-time.
Daton is a highly automated data pipeline that is an ideal tool to solve this problem with effective data integration from various inventory management systems like Vinculum, Olabi, Unicommerce and other marketing, sales, customer support systems, and the need for writing a single line of code. This data can then be consolidated in real-time in a data warehouse from which it can be analyzed to understand how much the starting stock was. The Sell-through-rate can then be calculated from the present as well as historic data stacked in data warehouses. All you need to do is sign up for Daton, and you will be up and running within minutes. Sign up for a free trial of Daton today!


